- 🐛 Fixed an issue that prevented you from exporting sessions.
changelog
- 🐛 Fixed an issue that would not take your timezone into account when filter on your site dashboard.
- 🤖 Added better support for LLM's to discover the API endpoints, including openapi.json, markdown support for docs and more.
- 🐛 Fixed an issue that could cause duplicate Kudos to be recorded on SPA sites that used Turbo or similar.
- 💅 Kudos indicator now has a correct thousands separator. Makes it easier to read.
- 💪 More spam detection changes today, especially targeting specific repeat hits globally across Tinylytics — which means it will globally stop certain hit patterns across the whole platform, not just at a site level.
- 😏 Improved spam detection on various hit patterns. Also showing historical hits in the "Spam Analysis" before this change has been implemented if you'd like to see and delete these. You're welcome. ✌️❤️
- 👾 Improved the ignore rules logic and documentation of how it works. This was confusing before, but now should be more detailed and robust in general. Also tweaked the UI for this.
- 👾 Improved the Spam Analysis screen to better score potential spam and allow you to filter by score and also delete by single filtered hits.
- ... 🚀 This should be first, but still testing for Plus accounts — you can now invite others to a site so you can share these with a client or friend. More on this after testing.
We've been busy, and just getting around the new features that shipped last week.
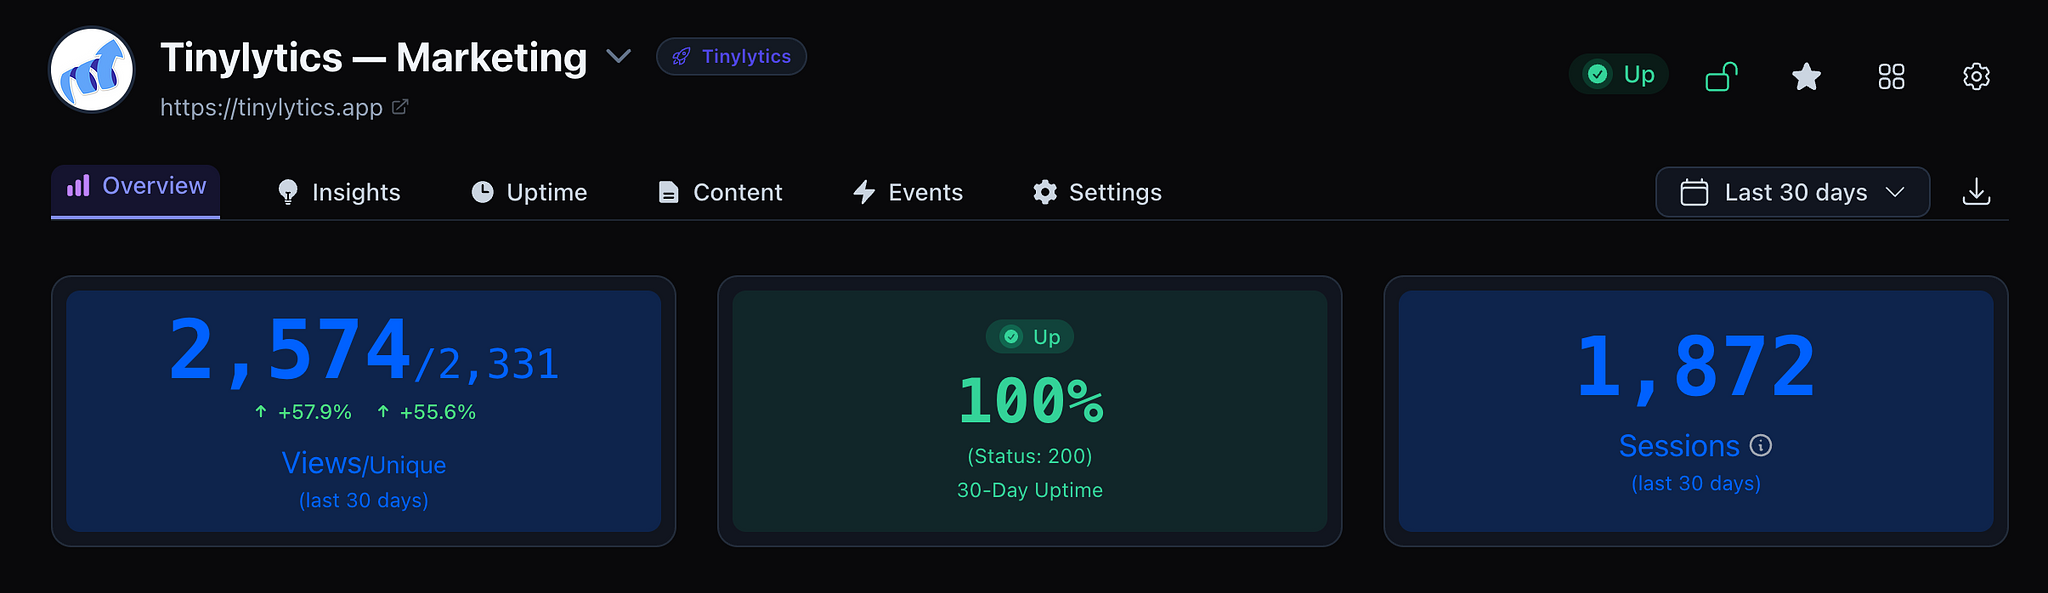
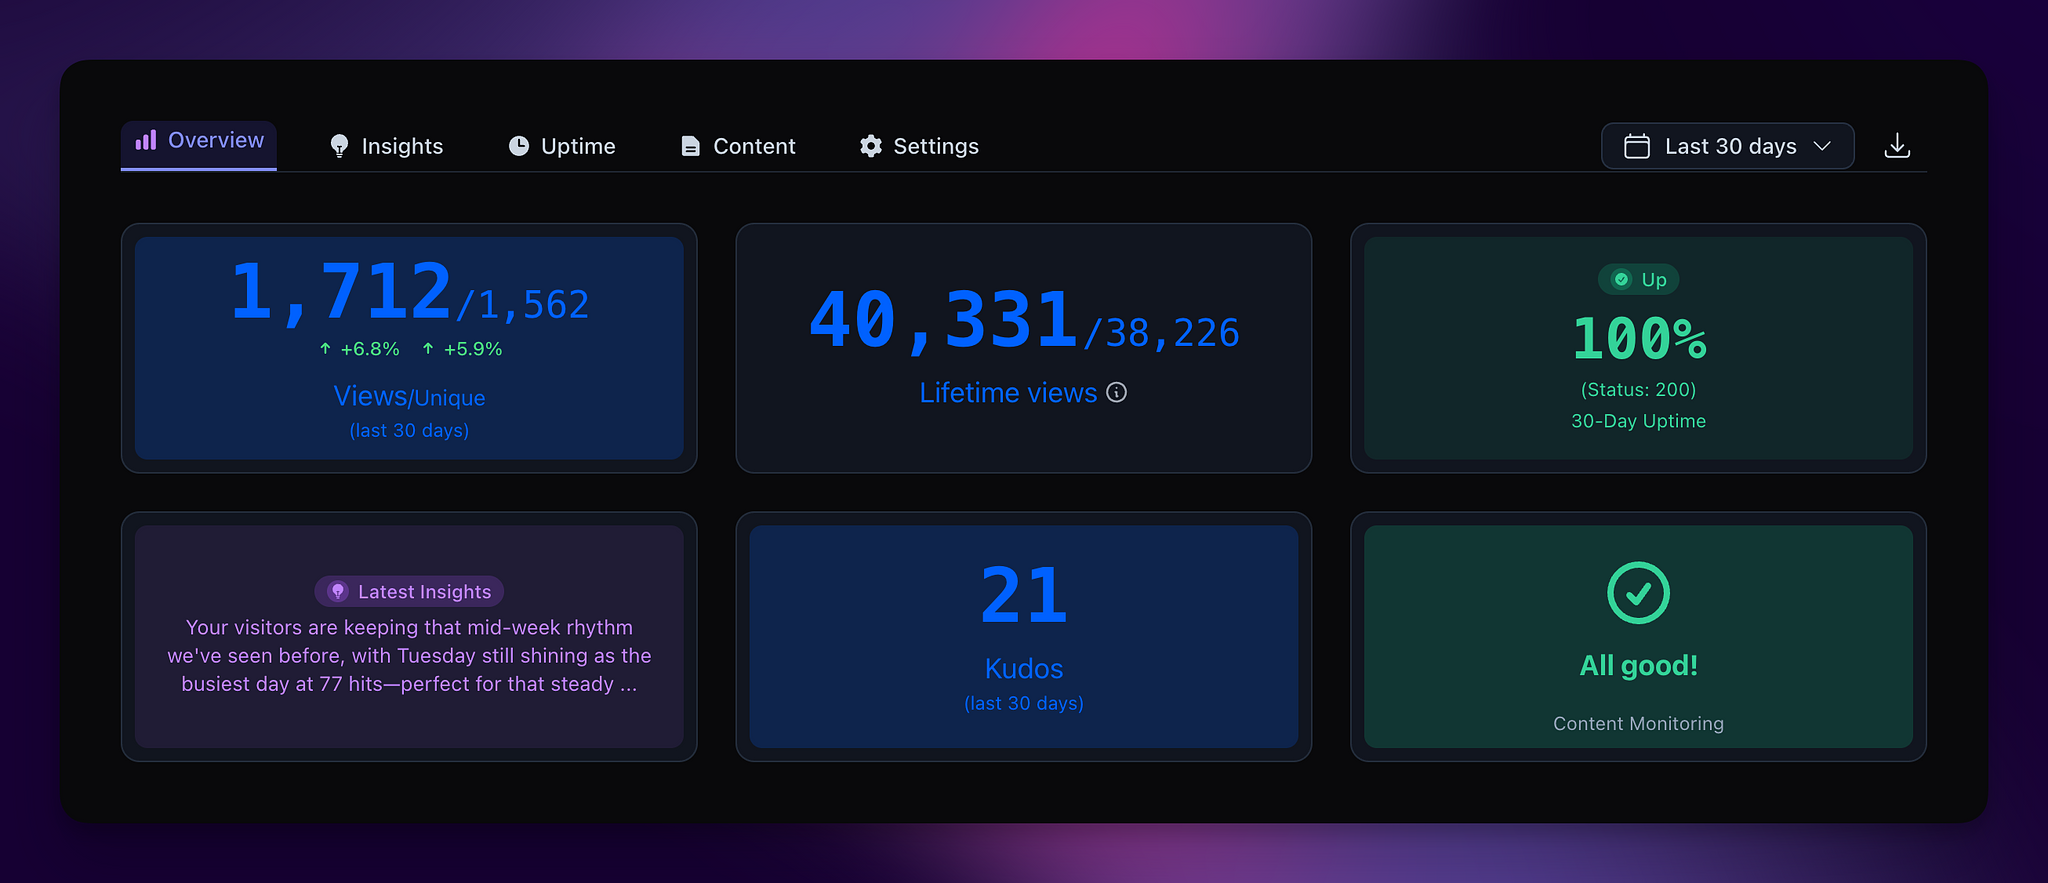
- ✨ You can now add a "Sessions" widget and also extra data table to your site dashboard. Sessions has been requested a few times, because you may want to know unique visitors, but then also know how many of those was a session. Well, now you can.
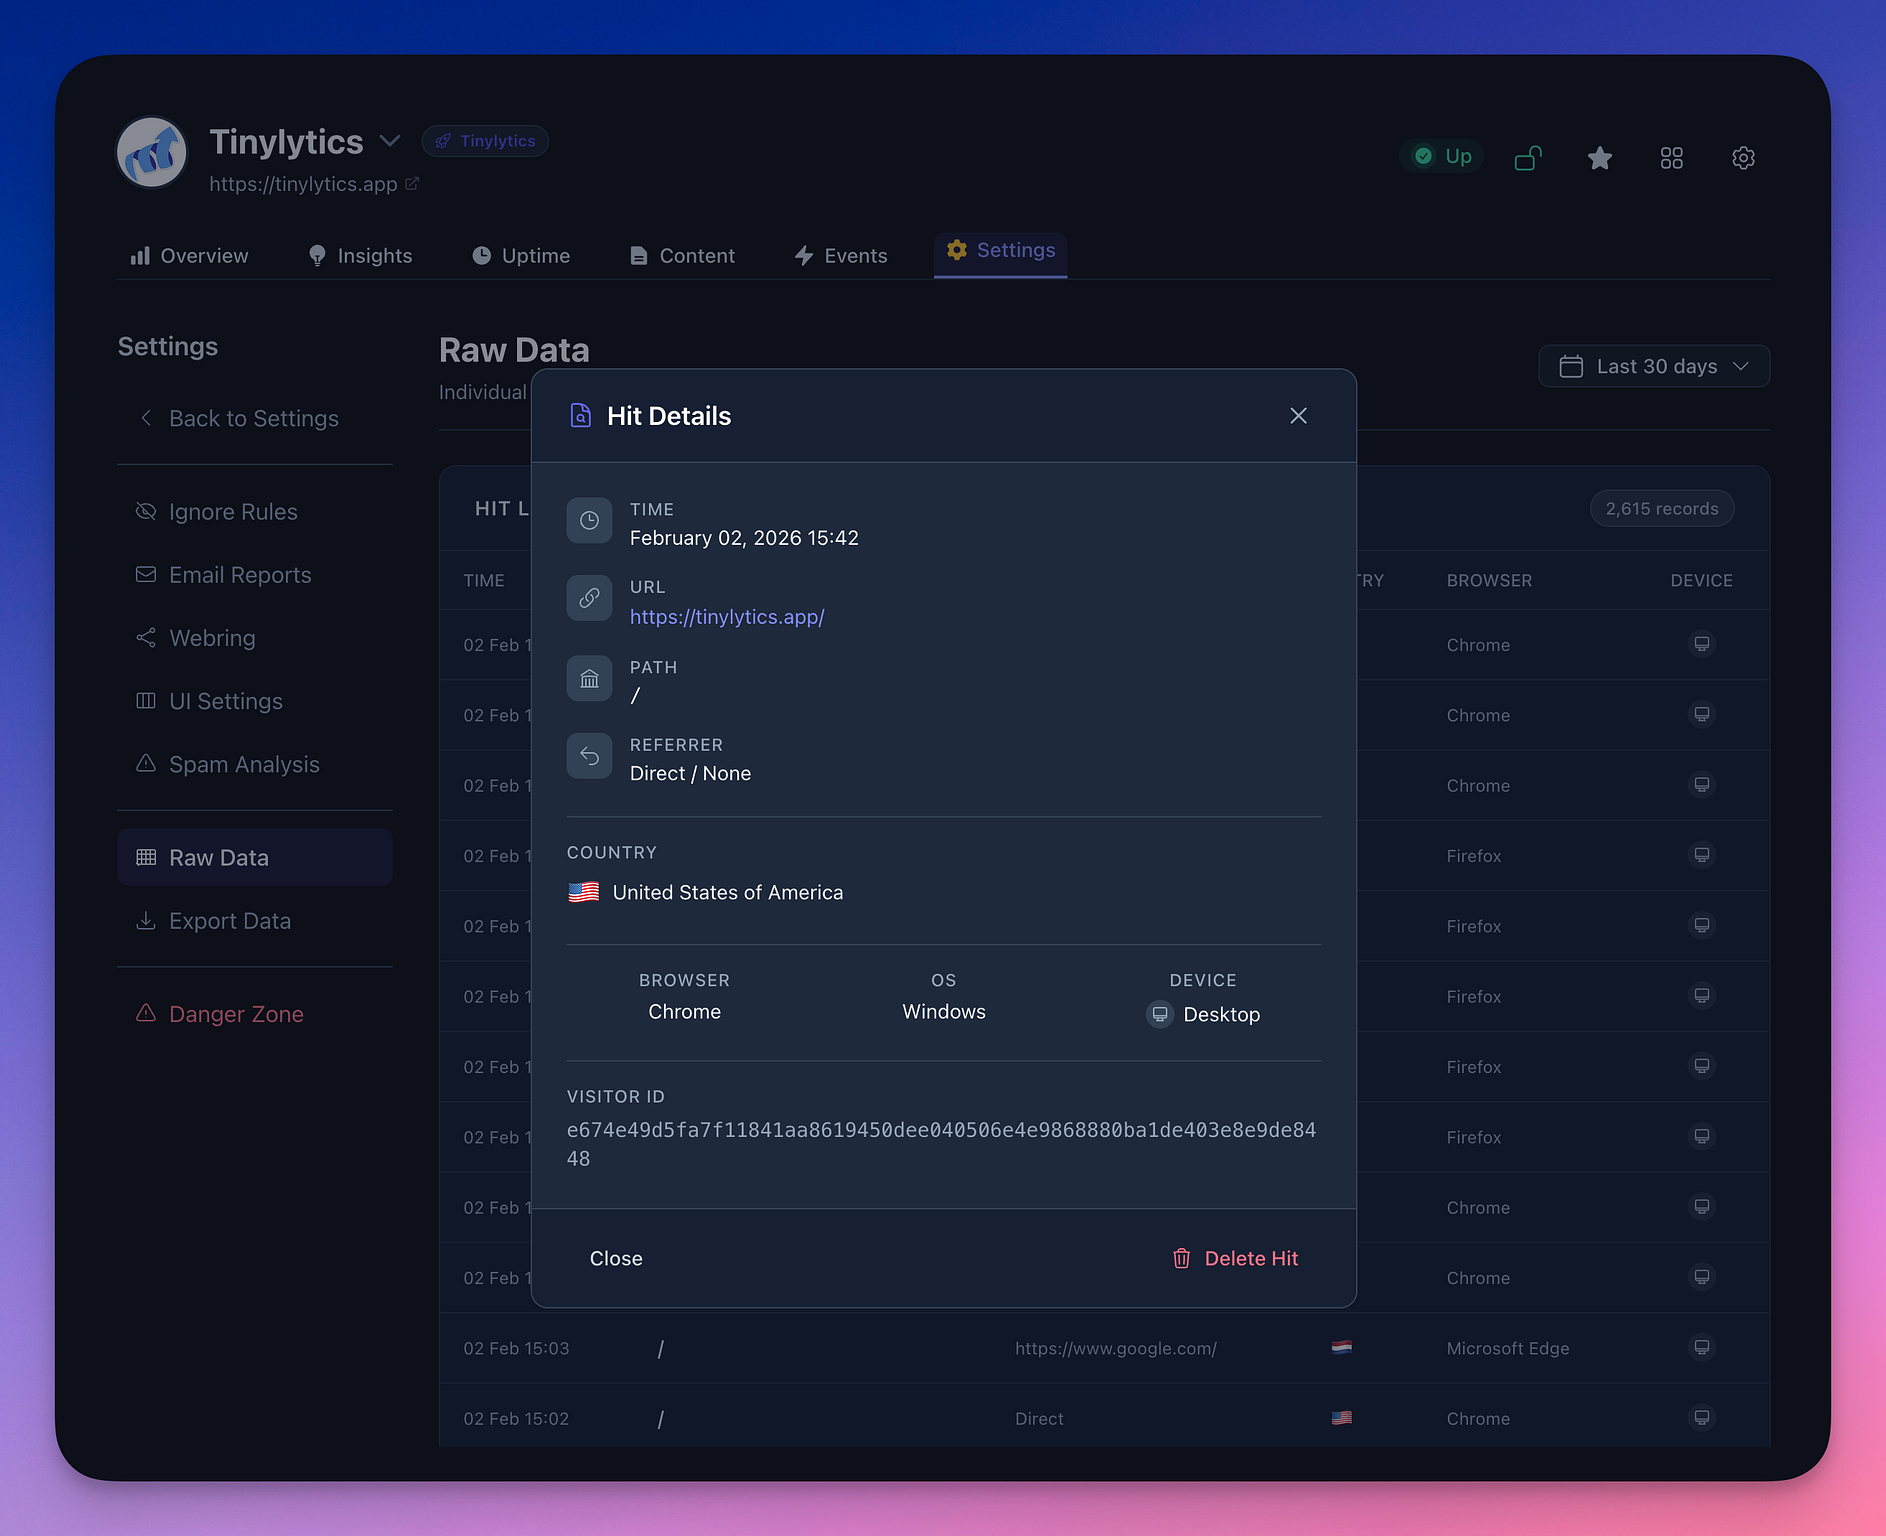
- 🧮 Now you have the ability to see the raw data that gets collected for a hit on your site settings screen. You can also filter by date. Click on a hit to see more details. You're able to delete the hit also if you don't like it for some reason.
- 🚀 Event tracking — Yes, finally, and I should have put this first! You can now track events within Tinylytics and show these on a dedicated Events tab. You can read about it in the docs here. Let me know what you think! You can filter to your hearts content.
- 👾 Using the quick site picker when you're on a page will now keep you on the same section/tab — for example if you have two sites, and you are on the Events page, and you then quickly switch to the other site, it will remain there. Thanks for the suggestion!
- ❤️ I am slowly working on a public directory for those that have opted in last year to show their sites on the Tinylytics Webring page with the extra settings. You can see the page here.
- 🐛 Made improvements to our script that loads to collect hits when using SPA sites, or sites with Turbo (like Tinylytics, Pika and others). Nothing for you to do here except sit back and relax.
- 😘 Sprinkled in a bit of fun and messaging on the dashboard and sites... just for fun.
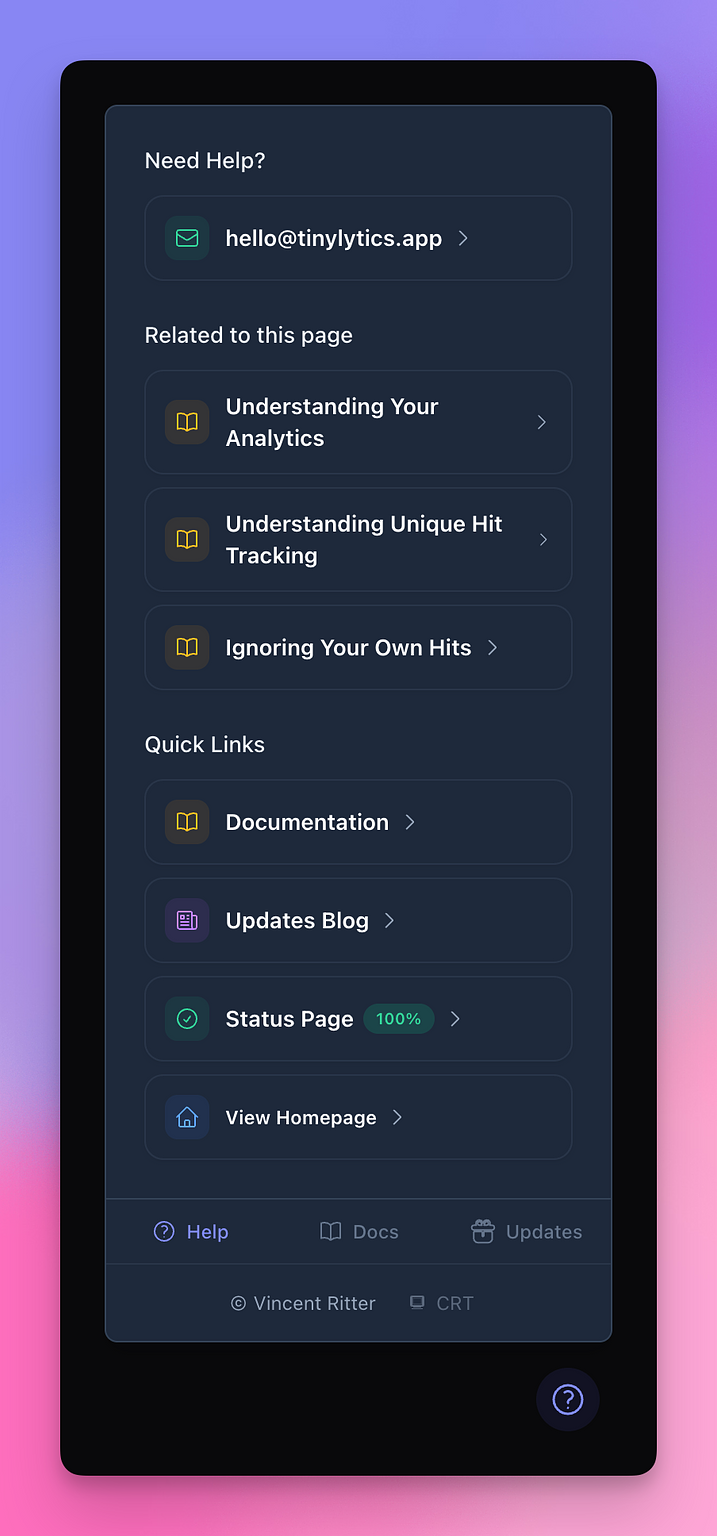
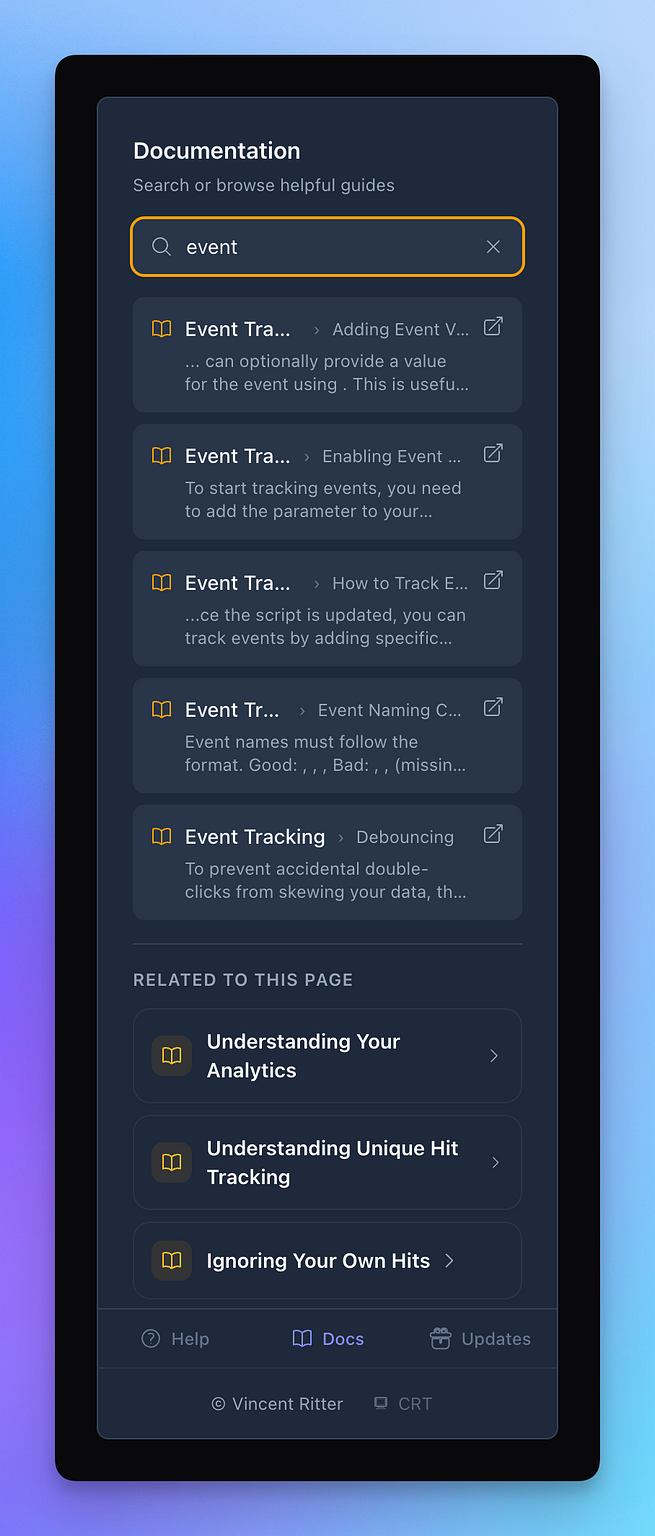
📖 When viewing a page, and you click on the help icon, Tinylytics will now try and surface relevant documentation for the given page if available. You can also now click on a dedicated docs tab and search, so it's easy to get everywhere.
- 🧹 Improved the header info on the site overview pages, allowing for easier navigation between groups and sites, better display if site stats are publicly viewable and which features have been enabled. Just gave it a nice polish.
- 👾 Better webhook notifications and uptime status display giving you relative times.
- 🐛 Fixed hit collection not resuming properly after resubscribing.
- 🧹 Various other tidy up around the interface.
- ... and something new.
- 👾 Content monitor emails will now, by default, ignore errors when we receive a 403 error (which basically forbids us from visiting the site in the Tinylytics end — which is common practice if they don't see a correct incoming browser version). There is a setting to turn this back on, but by default these will be silent errors.
- 👾 Continuing content monitor, we now also ignore timeout errors which can happen on our end when connecting. Additionally the content monitor might be going a little too fast and we might get rate limited — these errors will also no longer be surfaced. Just want to keep the amount of emails going out low.
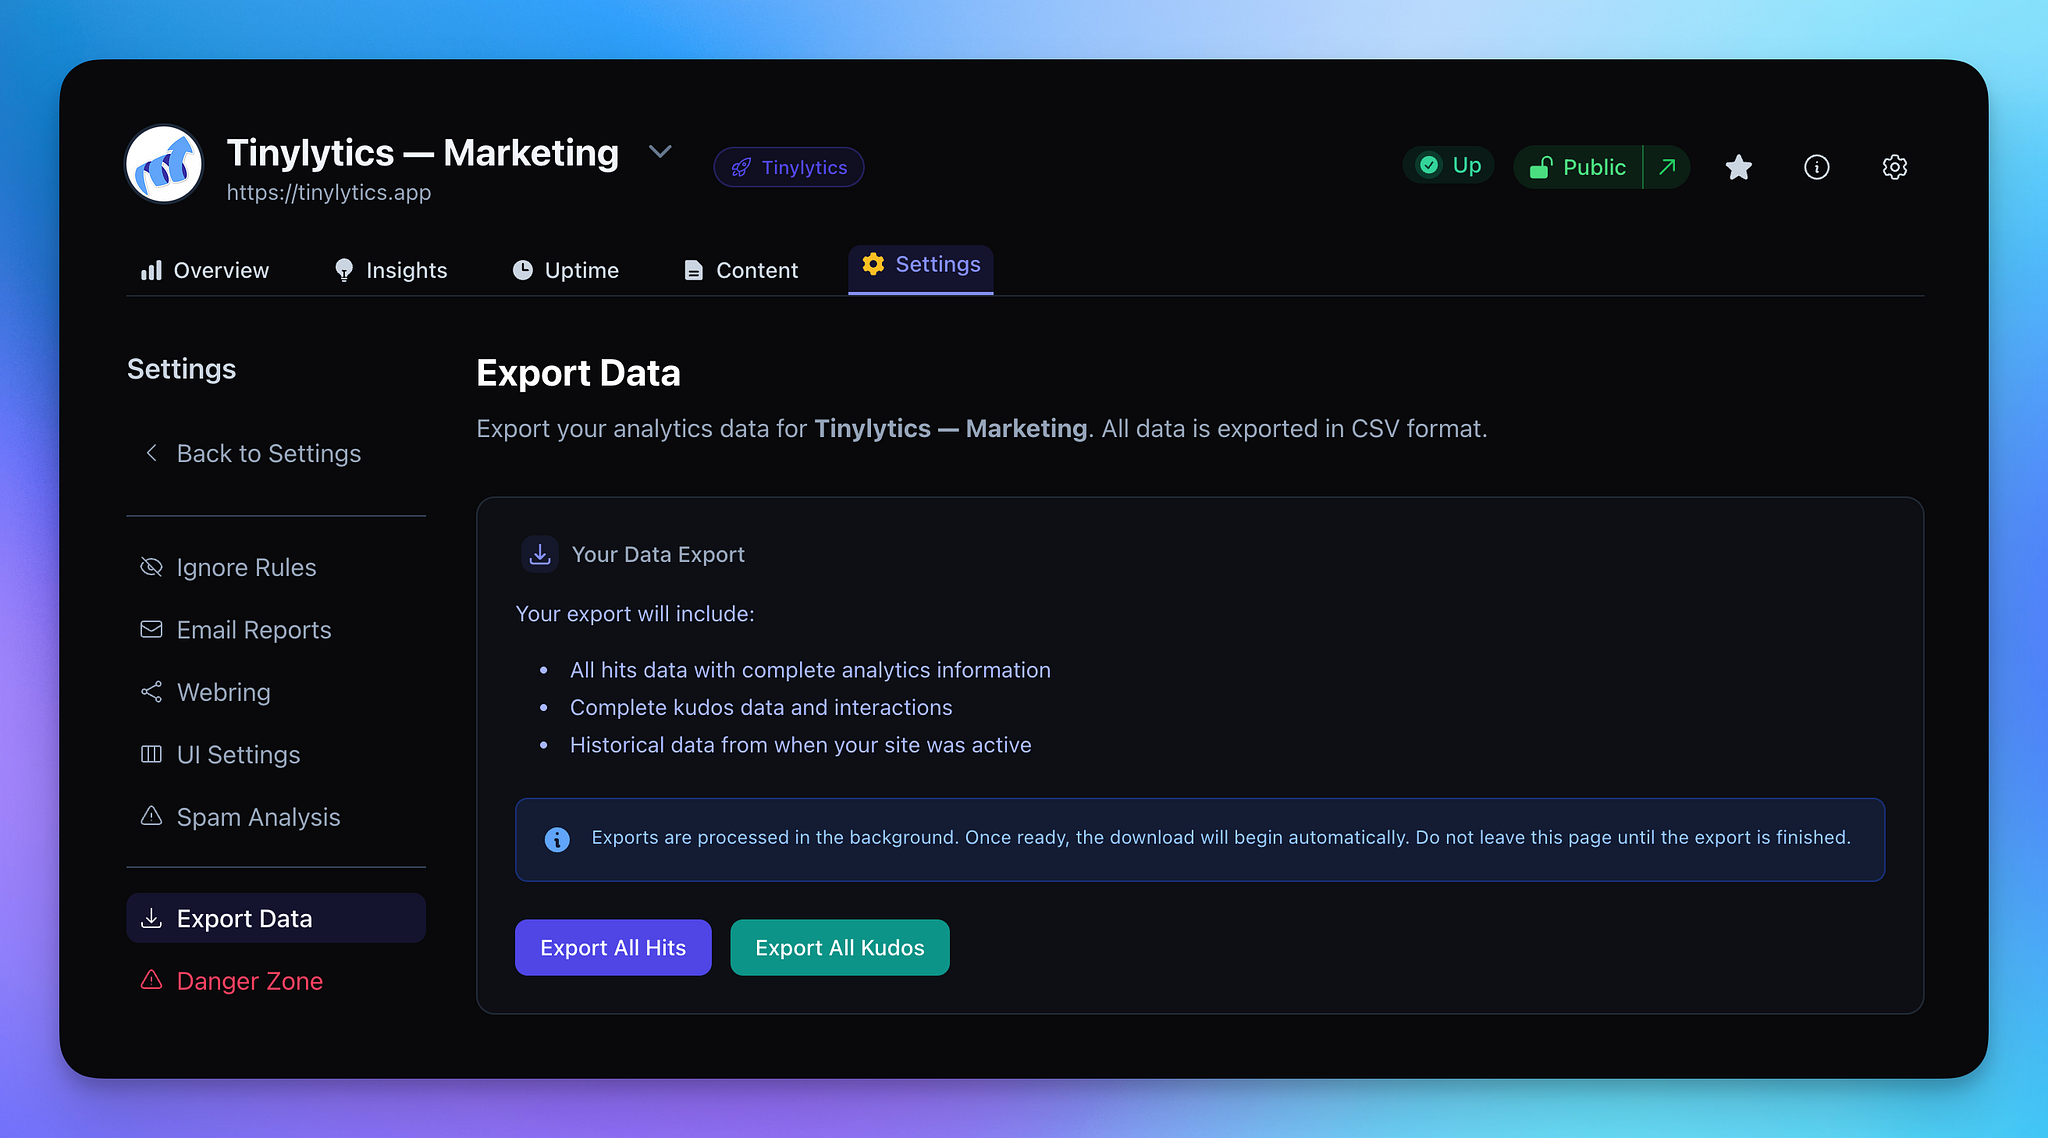
- 👾 There is now a new "Export Data" area on the individual site settings page allowing you to download all your raw hit data (not aggregated!) for your site — also includes a Kudos export if you have these enabled.
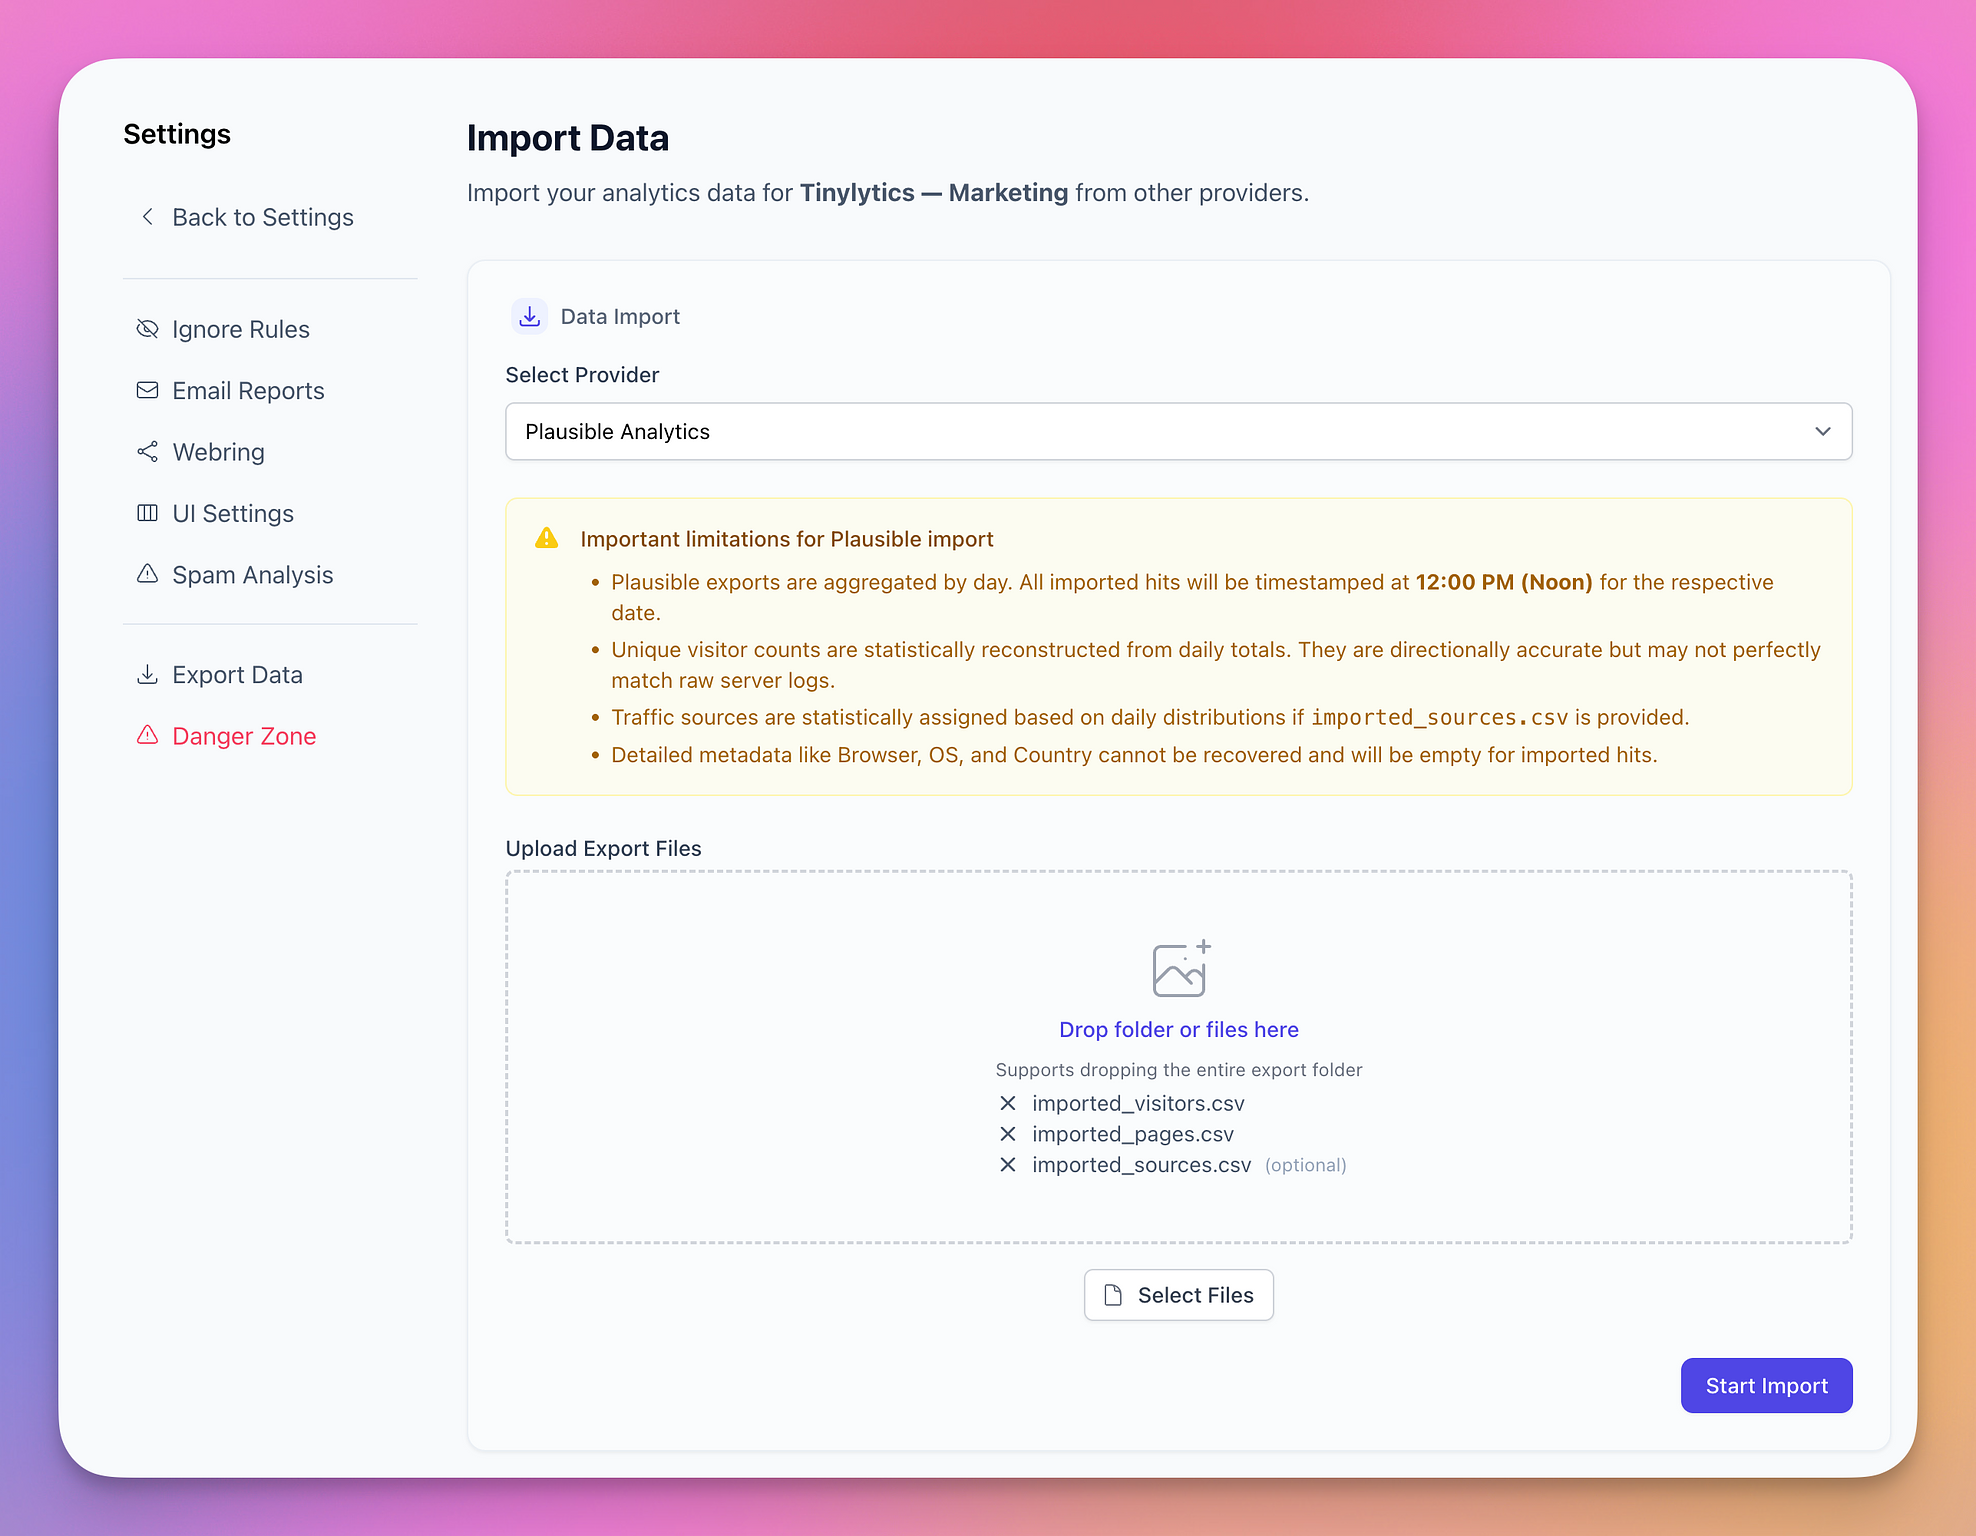
- 📊 Added preliminary support to import Plausible Analytics exports for your site. If you want details please just get in touch. Unfortunately Plausible only provides aggregated data and there are severe limits to the import at this time (and I don't think I can do more here unless they come up with better exports). Unsure why they don't give you all the data, but here we are 🤷♂️
🚀 Buttondown Archives Support:
Buttondown, the newsletter platform, just added support for adding Tinylytics on archives. Read more about their announcement here.
- 👍 Added the ability to unarchive a site, once it was archived.
- 👾 When archiving a site we'll now make sure email reports, content monitoring, insights and uptime monitoring are correctly stopped also.
- 🧹 Tweaked the archived site settings page so it's up to date with the design and showing the correct options.
- ❤️👍 Kudos stats on site overview:
You can now add your kudos/likes stats to your main site overview page by heading to your UI settings for your site and enabling it. It'll work just like all the other stats. You can also add a new "Kudos" widget to the top of the page. - 🌎💍 More webring settings:
Sites enabled for the webring now have a few extra options: You can add a title that will be displayed in the public webring directory (coming soon... finally), and there is an additional option to also show your lifetime hits on your site card that is displayed in the directory. - 👾 Experimental support for webmentions:
There is now experimental support for receiving webmentions from around the web, specifically a "like" from across the web, when supported. Head on over to the documentation to get started. I am looking for feedback here, so please let me know if something doesn't work for you.
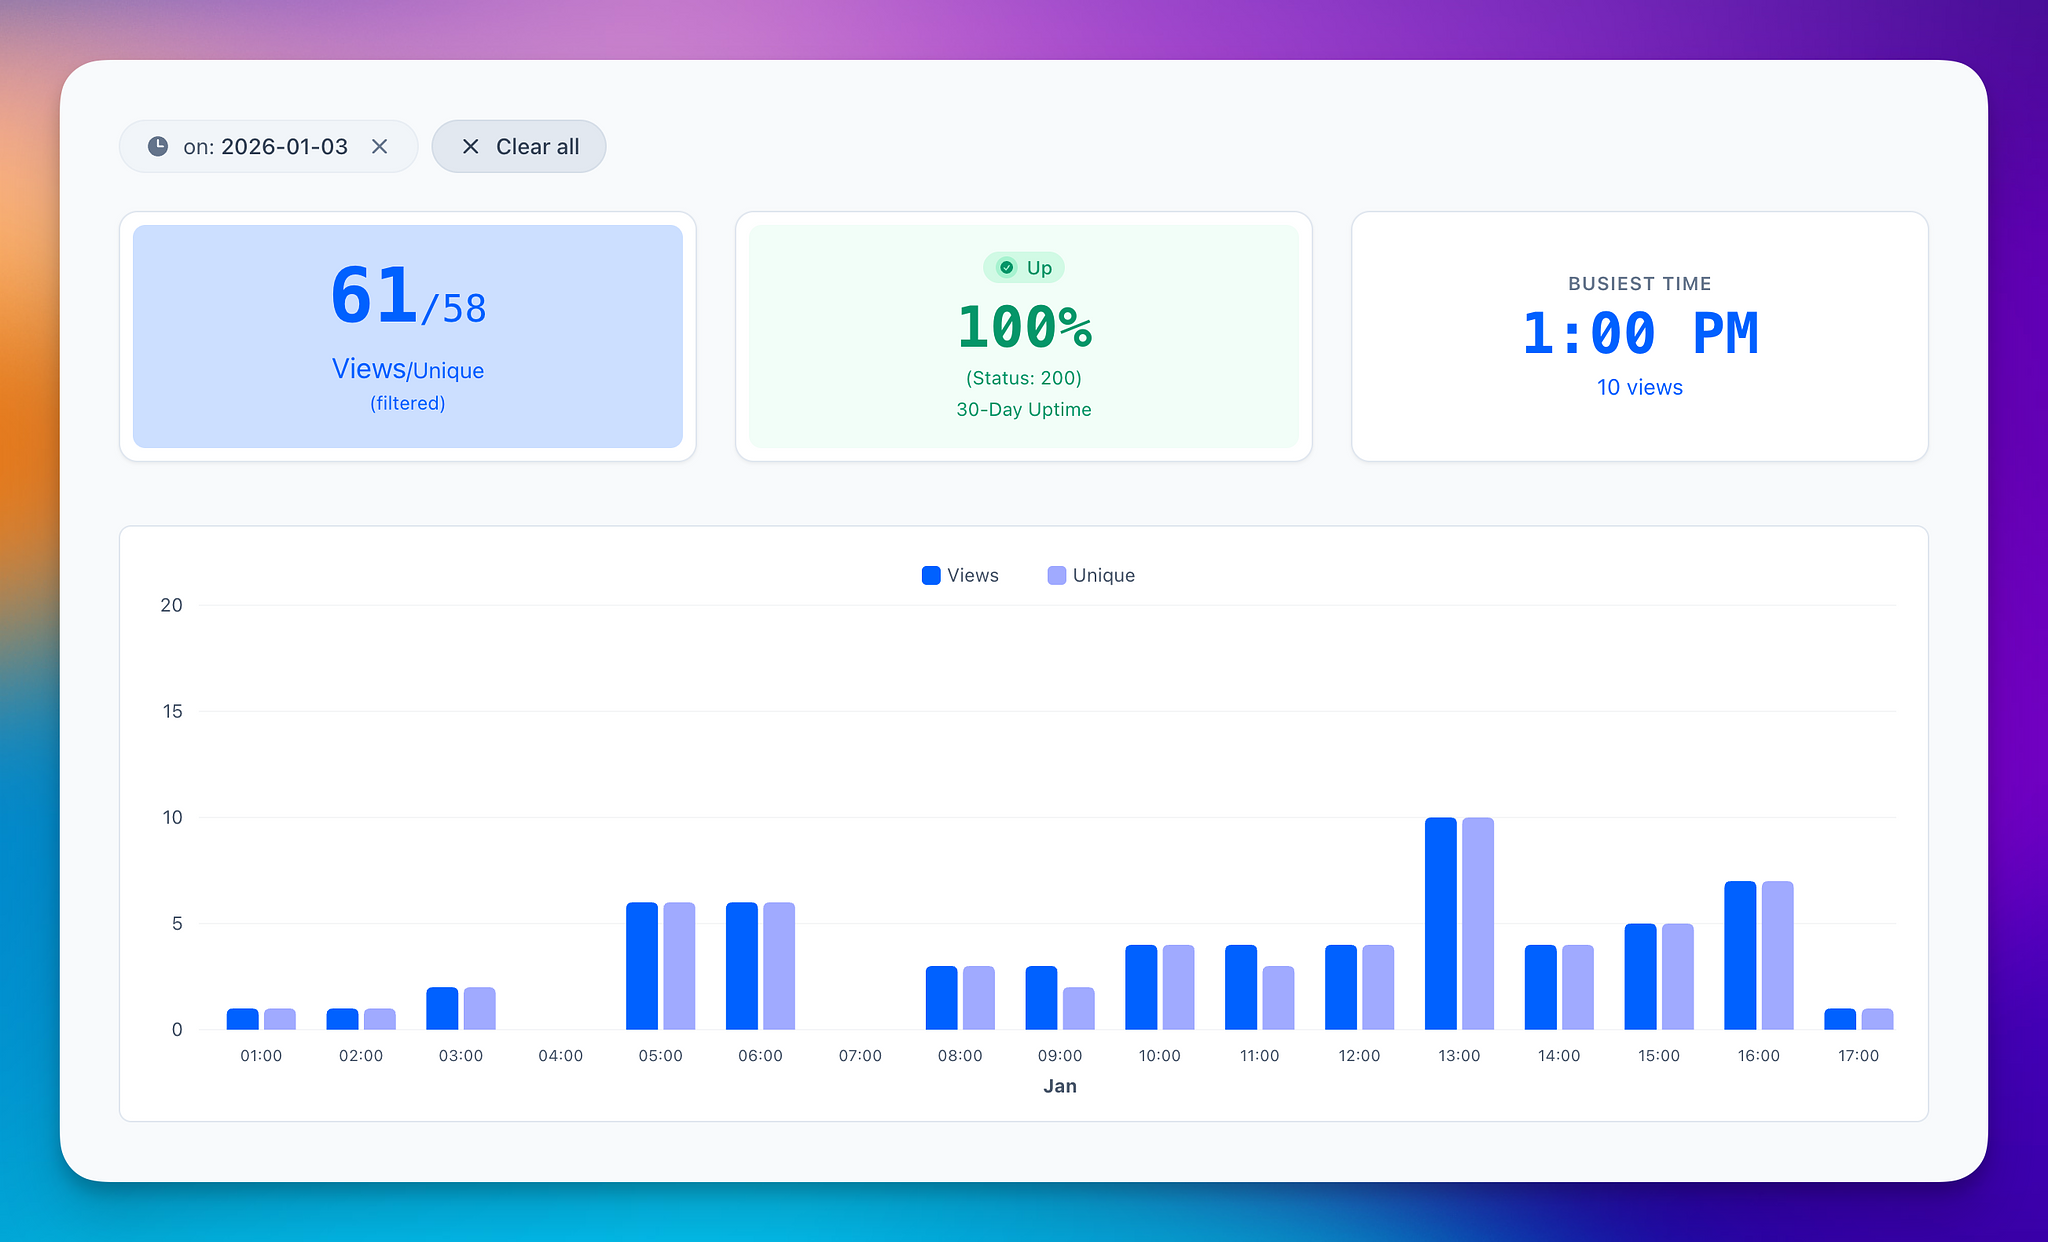
- 🚀 New: Busiest Time Widget
We've added a brand-new site widget that shows your site's busiest times across any date range. Perfect for spotting when your traffic peaks and things really get going! - ⏰ Hourly Breakdowns for Today & Yesterday
When viewing "Today" or "Yesterday," the chart now displays hourly data — giving you a much clearer picture of when your visitors are landing on your site.
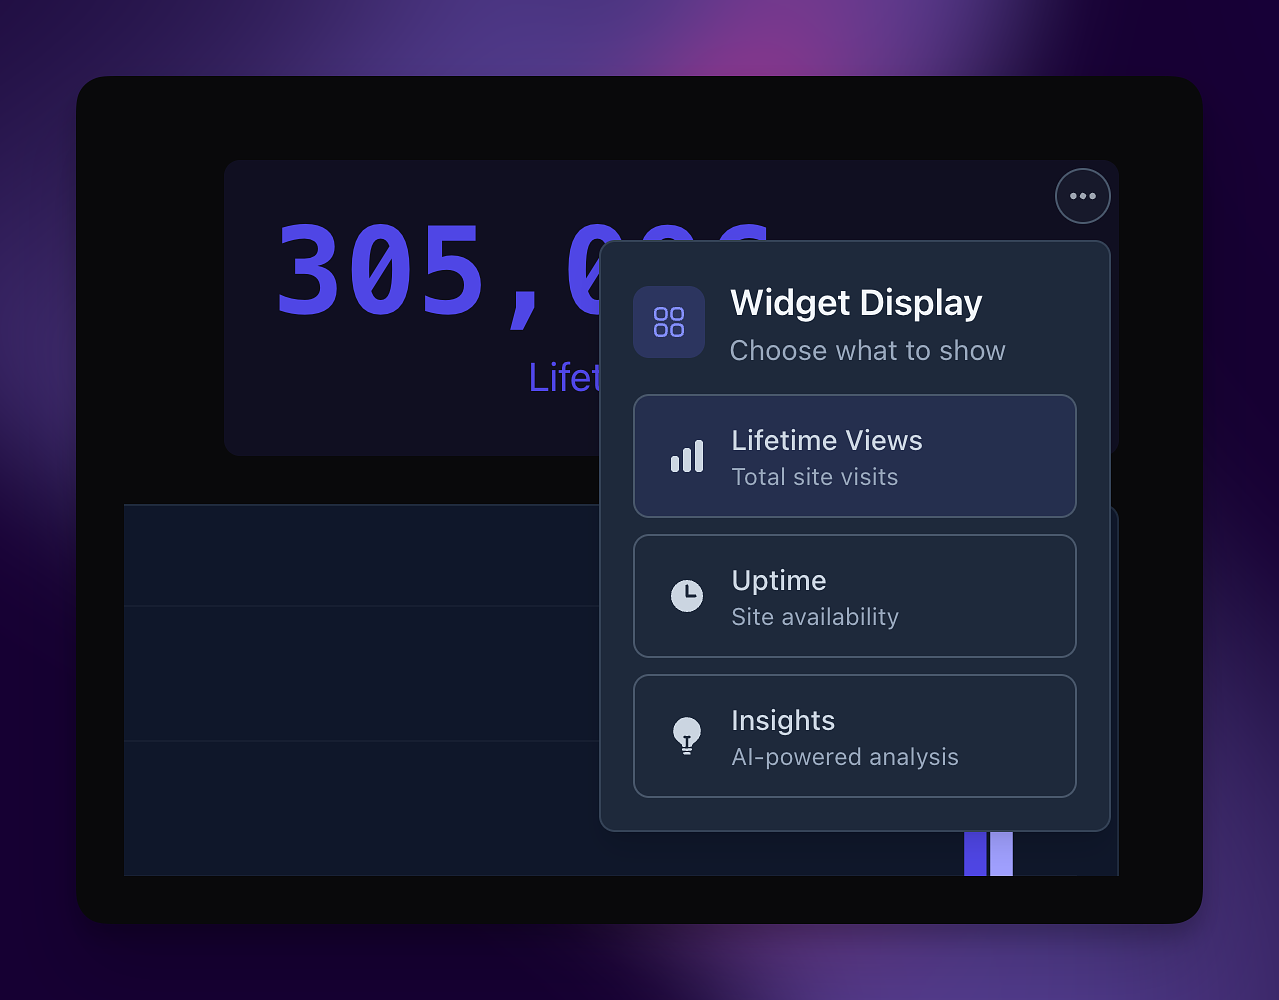
🚀✨ You can now add new widgets to your site overview page. This is a much nicer experience and you can customise it to suit your needs. Just hover over the area and you'll see a "Add Widget". You can remove and re-order them.
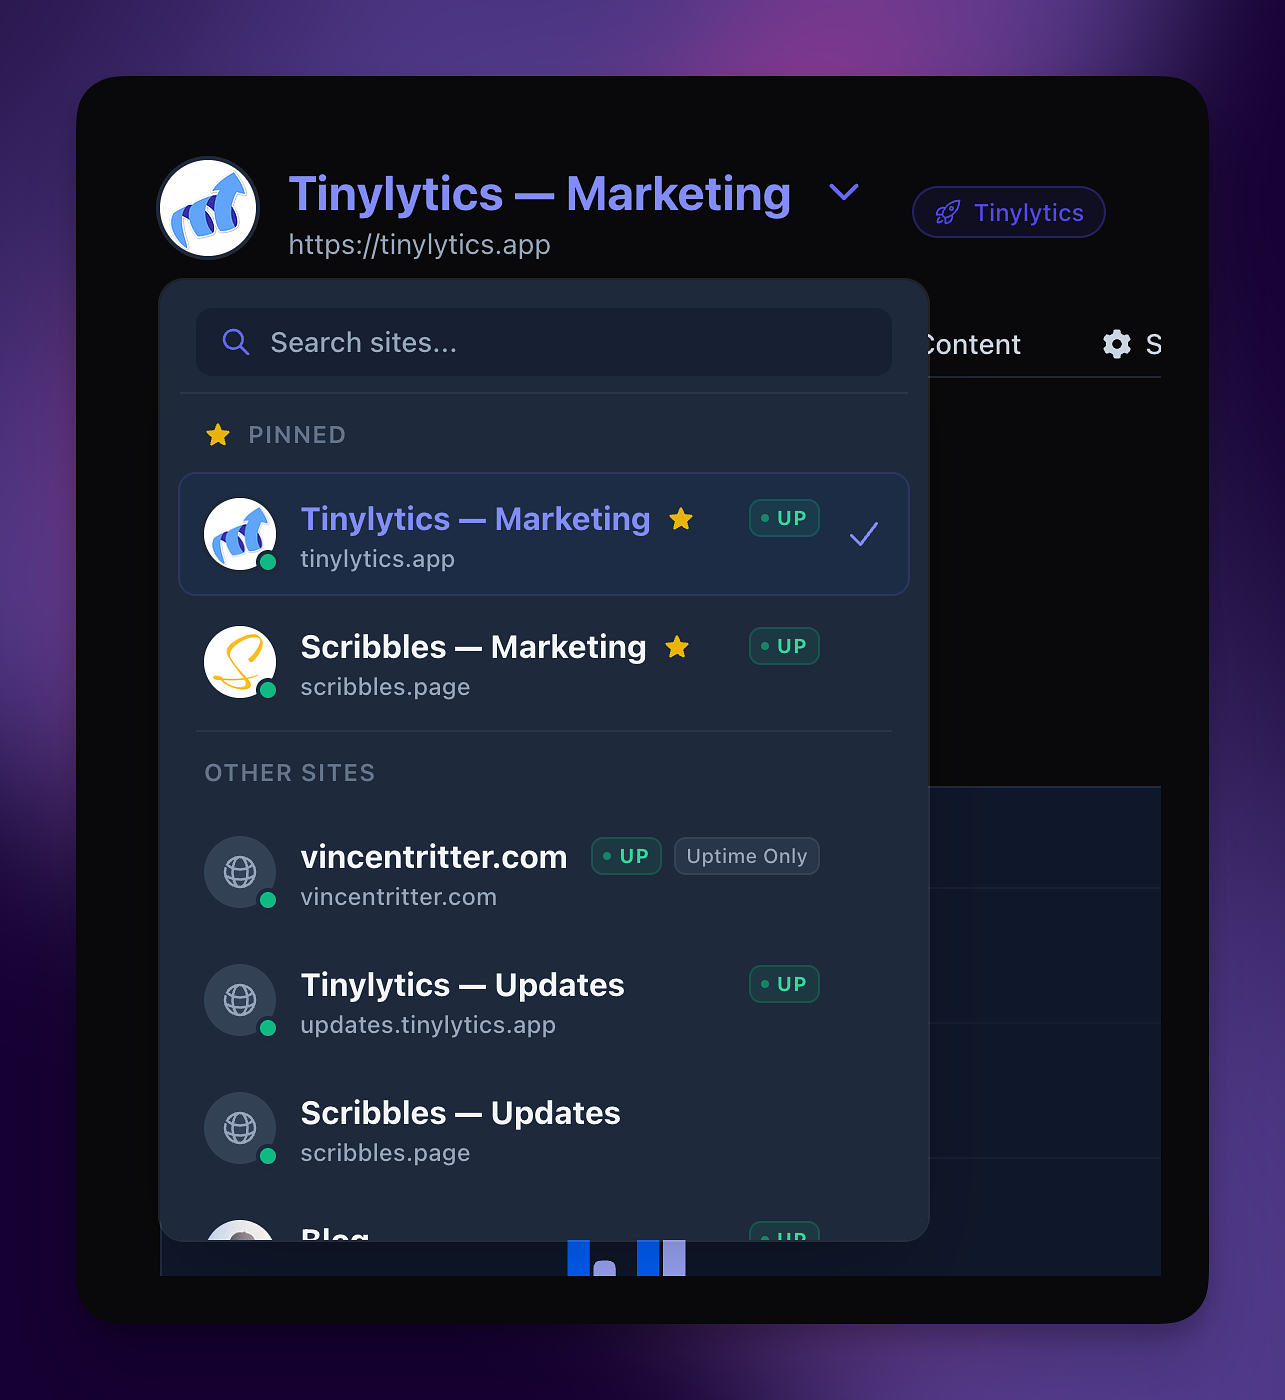
🚀 Added a new and improved site dropdown menu when viewing a site, allowing you to quickly navigate to other sites. Includes a search option to quickly filter your sites. For sites that have uptime enabled, it will show the current status.
🔥 Improved switching between widgets on the site overview page.
Happy New Year! ✨
- 🚀 Faster Dashboards: We've optimised how your site statistics load. Your dashboard should now feel much snappier and more responsive, especially for sites with a lot of traffic.
- 📅 New "Last Year" Filter: You can now easily view your analytics for the previous calendar year across all your sites and groups. Great to check for 2025!
- 🔍 Better Content Monitoring: Our content scanner will now automatically ignore any links or images within commented-out code on your site, ensuring your reports stay clean and relevant.
- 💎 Billing Improvements: We made the billing page much clearer so you can easily see your current usage, perks and allow you to change plans with ease.
- 🐛 Data Export: Fixed a bug that was affecting data exports when your subscription or trial expired.
👾 Added the ability to delete previous content monitor errors that are no longer needed — for example when a link was changed or replaced with another.